기능

chart에 value를 동적으로 추가

backgroundColor를 랜덤하게 설정 ( 결과가 Fix 되지않은 chart 리스트를 추가 할때 사용 )


// html
<canvas id="cChart"></canvas>

// javascript
var Chart_ctx = document.getElementById('cChart').getContext('2d');

// Chart Config
Chart_config = {
    type: 'pie',
    data: ..........
}

// Chart Create
var Chart = new Chart(Chart_ctx, Chart_config);


// Chart Data 동적 추가
Chart_config.data.datasets[0].data.push(1);

// Set backgroundColor 랜덤하게 값 추가 ( 투명도 30% )
var RGB_1 = Math.floor(Math.random() * (255 + 1))
var RGB_2 = Math.floor(Math.random() * (255 + 1))
var RGB_3 = Math.floor(Math.random() * (255 + 1))
var strRGBA = 'rgba(' + RGB_1 + ',' + RGB_2 + ',' + RGB_3 + ',0.3)'
Chart_config.data.datasets[0].backgroundColor.push(strRGBA);

참고

https://stackoverflow.com/questions/23095637/how-do-you-get-random-rgb-in-javascript

기능

1. Chart.js 2.x 버전 Pie Chart

2. 파이 차트 클릭 이벤트 ( Pie Chart Click Event ) - label 및 value 조회

3. 마우스 오버없이 레이블을 항상 백분율(%)값을 표시


html

* chart를 그리기 위한 canvas를 생성

* 다른 로직에서 canvas를 참고하기 위해 id를 지정 ( 예제는 cPieChart 으로 생성 )

<canvas id="cPieChart" style="min-height: 500px; height: 500px; max-height: 1000px; width: 700px; max-width: 100%;"></canvas>

javascript

* chart.js를 사용하기 위해 Chart.min.js 를 추가

* 마우스 오버없이 레이블을 항상 표시하기 위한 chartjs-plugin-datalabels@0.7.0 추가


* config의 data -> datasets -> datalabels 부분에 설정값을 지정

   align : 레이블 위치

   backgroundColor : ctx 정보를 가져와서 value가 0 이상인 경우만 출력

   color : ctx 정보를 가져와서 value가 0 이상인 경우만 출력

   formatter : value, ctx 정보를 가져와서 0 이상인 경우 백분율값을 구하여 리턴


* Pie Chart 생성 후 onClick Event 값을 가져와서 이벤트 처리

  getElementsAtEvent(evt) 함수로 클릭 이벤트 값을 조회

  activePoints[0]["_index"] 로 클릭한 차트의 위치값을 조회

   >> 만약 하나의 canvas에 여러개의 chart가 있는 경우 아래 형태로 조회

        activePoints[0]["_index"]

        activePoints[1]["_index"]

        activePoints[2]["_index"]


<script src="https://cdn.jsdelivr.net/npm/chart.js@2.9.4/dist/Chart.min.js"></script>
<script src="https://cdn.jsdelivr.net/npm/chartjs-plugin-datalabels@0.7.0"></script>

// Pie Chart ctx Get
var PieChart_ctx = document.getElementById('cPieChart').getContext('2d');

// Pie Chart Config Set
PieChart_config = {
    type: 'pie',
    data: {
        labels: ['OPEN', 'PROGRESSING', 'COMPLETE'],
        data: [13,11,14],
        datasets: [{
            label: 'Pie Chart Count',
            backgroundColor: [
                        'rgba(255, 99, 132, 0.2)',
                        'rgba(54, 162, 235, 0.2)',
                        'rgba(75, 192, 192, 0.2)'
                        ],
            borderColor: [
                        'rgba(255, 99, 132, 1)',
                        'rgba(54, 162, 235, 1)',
                        'rgba(75, 192, 192, 1)'
                        ],
            borderWidth: 1,
            datalabels: {
                labels: {
                    value: {
                        borderWidth: 2,
                        borderRadius: 4,
                        font: {size: 15},
                        formatter: function(value, ctx) {
                            var value = ctx.dataset.data[ctx.dataIndex];
                            return value > 0 ? Math.round(value / (ctx.dataset.data[0] + ctx.dataset.data[1] + ctx.dataset.data[2]) * 100) + ' %' : null;
                        },
                        color: function(ctx) {
                            var value = ctx.dataset.data[ctx.dataIndex];
                            return value > 0 ? 'white' : null;
                        },
                        backgroundColor:function(ctx) {
                            var value = ctx.dataset.data[ctx.dataIndex];
                            return value > 0 ? 'gray' : null;
                        },
                        padding: 4
                    }
                }
            }
        }]
    },
    options: {
        responsive: true,
        maintainAspectRatio : false,
        animation: false,
        legend: {
            position: 'left',
            display: true
        },
        title: {
            display: false,
            text: 'Pie Chart - Count',
            font: {
                size: 50
            },
            fontstyle: 'bold',
            position: 'top'
        }, 
        plugins: {
            legend: {
                position: 'left',
            },
            title: {
                display: true,
                text: 'Pie Chart - Count',
                font: { 
                    size: 25
                }
            }
        }
    }
};


// Pie Chart Create
var PieChart = new Chart(PieChart_ctx, PieChart_config);

// Pie Chart Event Set
document.getElementById("cPieChart").onclick = function(evt) {

    var activePoints = PieChart.getElementsAtEvent(evt);

    if(activePoints.length > 0)
    {
        //get the internal index of slice in pie chart
        var clickedElementindex = activePoints[0]["_index"];

        //get specific label by index 
        var label = PieChart.data.labels[clickedElementindex];

        //get value by index      
        var value = PieChart.data.datasets[0].data[clickedElementindex];

        // label and value Process
        
   }
};

참고

https://stackoverflow.com/questions/26257268/click-events-on-pie-charts-in-chart-js

https://chartjs-plugin-datalabels.netlify.app/samples/charts/line.html

https://chartjs-plugin-datalabels.netlify.app/samples/advanced/multiple-labels.html


Multiple Labels | chartjs-plugin-datalabels

Multiple Labels Use multiple labels configuration to display 3 labels per data, one for the index, one for the label and one for the value. Move the mouse over the chart to display label ids. { type: 'doughnut', data: { labels: labels, datasets: [{ backgro

chartjs-plugin-datalabels.netlify.app


현재 max worker threads 카운트 확인 및 수정

USE AdventureWorks2012 ;  
GO  
EXEC sp_configure 'show advanced options', 1;  
GO  
RECONFIGURE ;  
GO

-- 정보 확인
EXEC sp_configure 'max worker threads'

-- max worker threads를 900으로 변경
EXEC sp_configure 'max worker threads', 900 ;  
GO  
RECONFIGURE;  
GO

CPU Core별 사용 가능 카운트

CPU 수 32비트 컴퓨터(최대 SQL Server 2014(12.x)) 64비트 컴퓨터(최대 SQL Server 2016(13.x) SP1) 64비트 컴퓨터(SQL Server 2016(13.x) SP2 및 SQL Server 2017(14.x)부터)
< = 4 256 512 512
8 288 576 576
16 352 704 704
32 480 960 960
64 736 1472 1472
128 1248 2496 4480
256 2272 4544 8576

참고

https://docs.microsoft.com/ko-kr/sql/database-engine/configure-windows/configure-the-max-worker-threads-server-configuration-option?view=sql-server-ver15


max worker threads 서버 구성 옵션 구성 - SQL Server

최대 작업자 스레드 옵션을 사용하여 SQL Server에서 특정 요청을 처리하는 데 사용할 수 있는 작업자 스레드 수를 구성하는 방법을 알아봅니다.

docs.microsoft.com

CPU Core를 효율적으로 사용하기 위해, hyperthread 기법을 사용하여 물리 코어의 2배로 논리 코어를 할당하여 사용 하는 경우가 있음.


wmic 명령어로 물리 및 논리 코어 카운트 확인

  numberofcores : 물리코어

  numberoflogicalprocessors : 논리코어

-- 아래는 소켓이 2개이며 하이퍼 스레딩을 사용하여 물리 CPU는 16개, 논리 CPU는 32개
C:W>wmic cpu get numberofcores,numberoflogicalprocessors
numberofcores	numberoflogicalprocessors
8		16
8		16

MSINFO32

시작 - 실행 - MSINFO32 실행


AdminLTE

https://adminlte.io/


Free Bootstrap Admin Template | AdminLTE.IO

Bootstrap is raking over the world and so is React. Therefore, we decided to showcase these outstanding React Bootstrap templates May 18, 2021

adminlte.io

W3schools

https://www.w3schools.com/html/default.asp


HTML Tutorial

HTML Tutorial HTML is the standard markup language for Web pages. With HTML you can create your own Website. HTML is easy to learn - You will enjoy it! Start learning HTML now » Easy Learning with HTML "Try it Yourself" With our "Try it Yourself" editor,

www.w3schools.com

javatpoint

https://www.javatpoint.com/html-tutorial


Learn HTML Tutorial - javatpoint

Learn HTML Tutorial or HTML 5 Tutorial for beginners and professionals with tags, elements, tables, forms, anchor, image, heading, marquee, textarea, div, audio, video, header, footer etc.

www.javatpoint.com

DataTables

https://datatables.net/examples/index


DataTables examples - Examples index

Examples index One of the best ways to learn how to do anything new (including software APIs!) is to get your hands dirty as quickly as possible. These examples will show you how to perform tasks ranging from something as simple as applying DataTables to a

datatables.net

html

<table id="example" class="stripe" style="width:100%">
        <thead>
            <tr>
                <th>Name</th>
                <th>Position</th>
                <th>Office</th>
                <th>Age</th>
                <th>Start date</th>
                <th>Salary</th>
            </tr>
        </thead>
        <tbody>
            <tr>
                <td>Tiger Nixon</td>
                <td>System Architect</td>
                <td>Edinburgh</td>
                <td>61</td>
                <td>2011/04/25</td>
                <td>$320,800</td>
            </tr>
            <tr>
                <td>Garrett Winters</td>
                <td>Accountant</td>
                <td>Tokyo</td>
                <td>63</td>
                <td>2011/07/25</td>
                <td>$170,750</td>
            </tr>
            <tr>
                <td>Ashton Cox</td>
                <td>Junior Technical Author</td>
                <td>San Francisco</td>
                <td>66</td>
                <td>2009/01/12</td>
                <td>$86,000</td>
            </tr>
            <tr>
                <td>Cedric Kelly</td>
                <td>Senior Javascript Developer</td>
                <td>Edinburgh</td>
                <td>22</td>
                <td>2012/03/29</td>
                <td>$433,060</td>
            </tr>
            <tr>
                <td>Airi Satou</td>
                <td>Accountant</td>
                <td>Tokyo</td>
                <td>33</td>
                <td>2008/11/28</td>
                <td>$162,700</td>
            </tr>
            
            ............
            
            <tr>
                <td>Donna Snider</td>
                <td>Customer Support</td>
                <td>New York</td>
                <td>27</td>
                <td>2011/01/25</td>
                <td>$112,000</td>
            </tr>
        </tbody>
        <tfoot>
            <tr>
                <th>Name</th>
                <th>Position</th>
                <th>Office</th>
                <th>Age</th>
                <th>Start date</th>
                <th>Salary</th>
            </tr>
        </tfoot>
    </table>

javascript

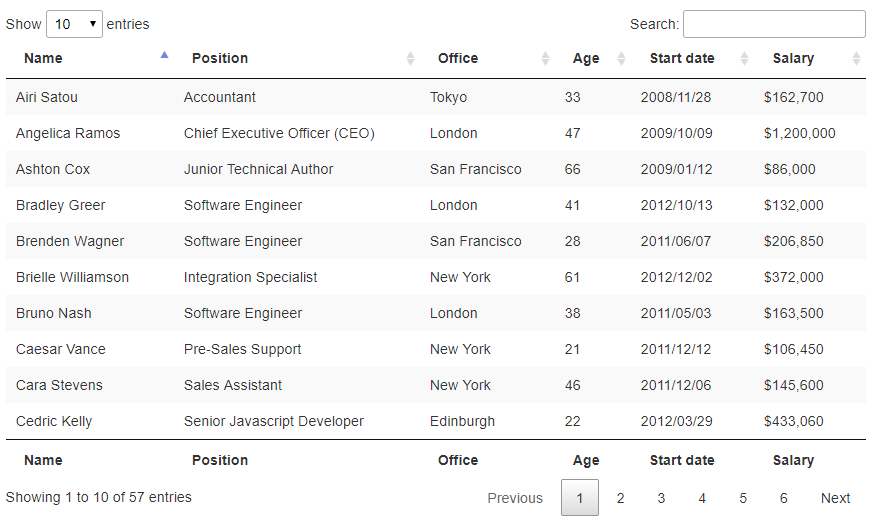
$(document).ready(function() {
    $('#example').DataTable();
} );

In addition to the above code, the following Javascript library files are loaded for use in this example:

https://code.jquery.com/jquery-3.5.1.js
https://cdn.datatables.net/1.10.25/js/jquery.dataTables.min.js

css

The following CSS library files are loaded for use in this example to provide the styling of the table:

https://cdn.datatables.net/1.10.25/css/jquery.dataTables.min.css

참고

https://datatables.net/examples/styling/stripe.html


DataTables example - Base style - stripe

Base style - stripe This example shows DataTables with just the stripe class specified. Name Position Office Age Start date Salary Tiger Nixon System Architect Edinburgh 61 2011/04/25 $320,800 Garrett Winters Accountant Tokyo 63 2011/07/25 $170,750 Ashton

datatables.net

javascript

var json = { 'NAME':'홍길동', 'SEX':'남', 'AGE':'99세'};

for(key in json) {
    alert('key:' + key + ' / ' + 'value:' + json[key]);
}

jquery

var json = { 'NAME':'홍길동', 'SEX':'남', 'AGE':'99세'}; 

$.each(json, function(key, value){
    alert('key:' + key + ' / ' + 'value:' + value);
});

참고

https://gent.tistory.com/17


[javascript|자바스크립트] foreach 구문을 이용하여 JSON 값 쉽게 가져오기 (json key get value)

자바스크립트의 foreach 구문을 이용하여 JSON 객체의 키(key)와 값(value)를 쉽게 가져올 수 있다. jQuery를 사용한다면 $.each 구문을 대신 사용할 수도 있다. ■ Javascript var json = { 'NAME':'홍길동', 'S..

gent.tistory.com

html의 td style 부분에 아래 내용을 추가

{ white-space:pre-line , word-break: break-all}

<table id="test_table">
  <thead>
    <tr>
      <th style="text-align:center;">ID</th>
      <th style="text-align:center;">Info Detail</th>
      <th style="text-align:center;">Date</th>
    </tr>
  </thead>
  <tbody>
    <tr>
      <td> 1 </td>
      <td style="white-space:pre-line;word-break: break-all;">
        Info 1
        Info 2
        Value 1
        Value 2
      </td>
      <td>'2021-07-10 09:00:00' 
      </td>
    </tr>
  </tbody>
  <tfoot>
  </tfoot>
</table>

참고

https://stackoverflow.com/questions/10937218/how-to-show-multiline-text-in-a-table-cell


How to show multiline text in a table cell

I want to show a paragraph from database into a table cell. The result is a large 1 line, ignoring how its organised in database. ignoring 'enters' for example (new lines) I want to show it exactly

stackoverflow.com

요약

[cmd 관리자 모드로 접속] 


--명령어 실행
diskpart

-- disk 리스트 확인
list disk

-- disk 선택
select disk 1

-- disk 활성화
online disk
-- readonly 설정 복구
attributes disk clear readonly


예제

DISKPART> list disk

  디스크 ###  상태           크기     사용 가능     Dyn  Gpt
  ----------  -------------  -------  ------------  ---  ---
  디스크 0    온라인        279 GB           0 B
  디스크 1    예약됨        558 GB           0 B
  디스크 2    예약됨        279 GB           0 B

DISKPART> select disk 1

1 디스크가 선택한 디스크입니다.

DISKPART> online disk

가상 디스크 서비스 오류:
지정한 디스크 또는 볼륨은 Microsoft 장애 조치(failover) 클러스터링 구성 요소에서
 관리합니다. 이 작업을 수행하려면 디스크가 클러스터 유지 관리 모드이고 클러스터
리소스 상태가 온라인이어야 합니다.

<<< 클러스터에 추가한 노드 제거...(클러스터에 노드 추가시 저장소 포함으로 설정하여 문제가 발생함...)

DISKPART> online disk

DiskPart에서 선택한 디스크를 온라인으로 설정했습니다.

DISKPART> attributes disk clear readonly

디스크 특성을 지웠습니다.

DISKPART> select disk 2

2 디스크가 선택한 디스크입니다.

DISKPART> online disk

DiskPart에서 선택한 디스크를 온라인으로 설정했습니다.

DISKPART> attributes disk clear readonly

디스크 특성을 지웠습니다.

DISKPART> list disk

  디스크 ###  상태           크기     사용 가능     Dyn  Gpt
  ----------  -------------  -------  ------------  ---  ---
  디스크 0    온라인        279 GB           0 B
  디스크 1    온라인        558 GB           0 B
* 디스크 2    온라인        279 GB           0 B

DISKPART>

lsof ? 

- List Open Files 명령어로, 열려진 파일들을 보는 명령어

- 시스템에서 동작하고 있는 모든 프로세스에 의해서 열려진 파일들에 대한 정보를 보여주는 시스템 관리 명령어


사용법 참고 : https://blog.cafe24.com/1989


삭제파일 복원 방법

DB 혹은 Process에서 사용중에 삭제되어 (deleted) 상태로 남아있는 파일을 복사하여 복원

복원 예제

lsof 명령어로 deleted 및 복원 파일명이 포함된 파일을 조회

pid 번호 확인 : 두번째 항목 ( 예제는 6505 )

삭제중 임시로 유지중인 object 위치 확인

위치 : /proc/[PID]/fd/[object 번호]

붉은색 번호가 처리중 삭제되어 링크가 깨진 object

삭제중 임시로 유지중인 object 번호 확인 ( 예제는 1489 )

위치 : /proc/[PID]/fd/[object 번호]

object 번호를 이용하여 복원

cp [object 번호] 복원 위치


to Top